BACKGROUND INFORMATION
The Maya had an everlasting effect on their environment in Central America, shaping it and leaving behind traces of their structures, pyramids, ceramics, lithics and agriculture. The Maya civilization occupied various territories in Central America, including Belize, a small country on the Caribbean coast. In the past three decades, archaeologists have been conducting many research projects aimed at uncovering and interpreting the remains of Maya culture in Belize (Garrison 2007). One topic that Maya archaeologists examine is social status by analyzing settlement patterns. Archaeologists look for clues in the environment to examine communities and their social relationships with one another. However, there is dense overgrown vegetation that makes it difficult to conduct surveys to properly document the sites in Belize. There are recent technologies and methods to get around dense vegetation and collect information indirectly. In order to examine the landscape, archaeologists use various tools such as Geographic Information Systems (GIS) and remote sensing, which allow researchers to gather data from a bird’s eye view and to draw conclusions about a culture and its communities. For my research project, I will examine the application of remote sensing and the analysis of satellite imagery in the Maya Lowlands in northwestern Belize in order to predict the locations of unknown ancient Maya sites.
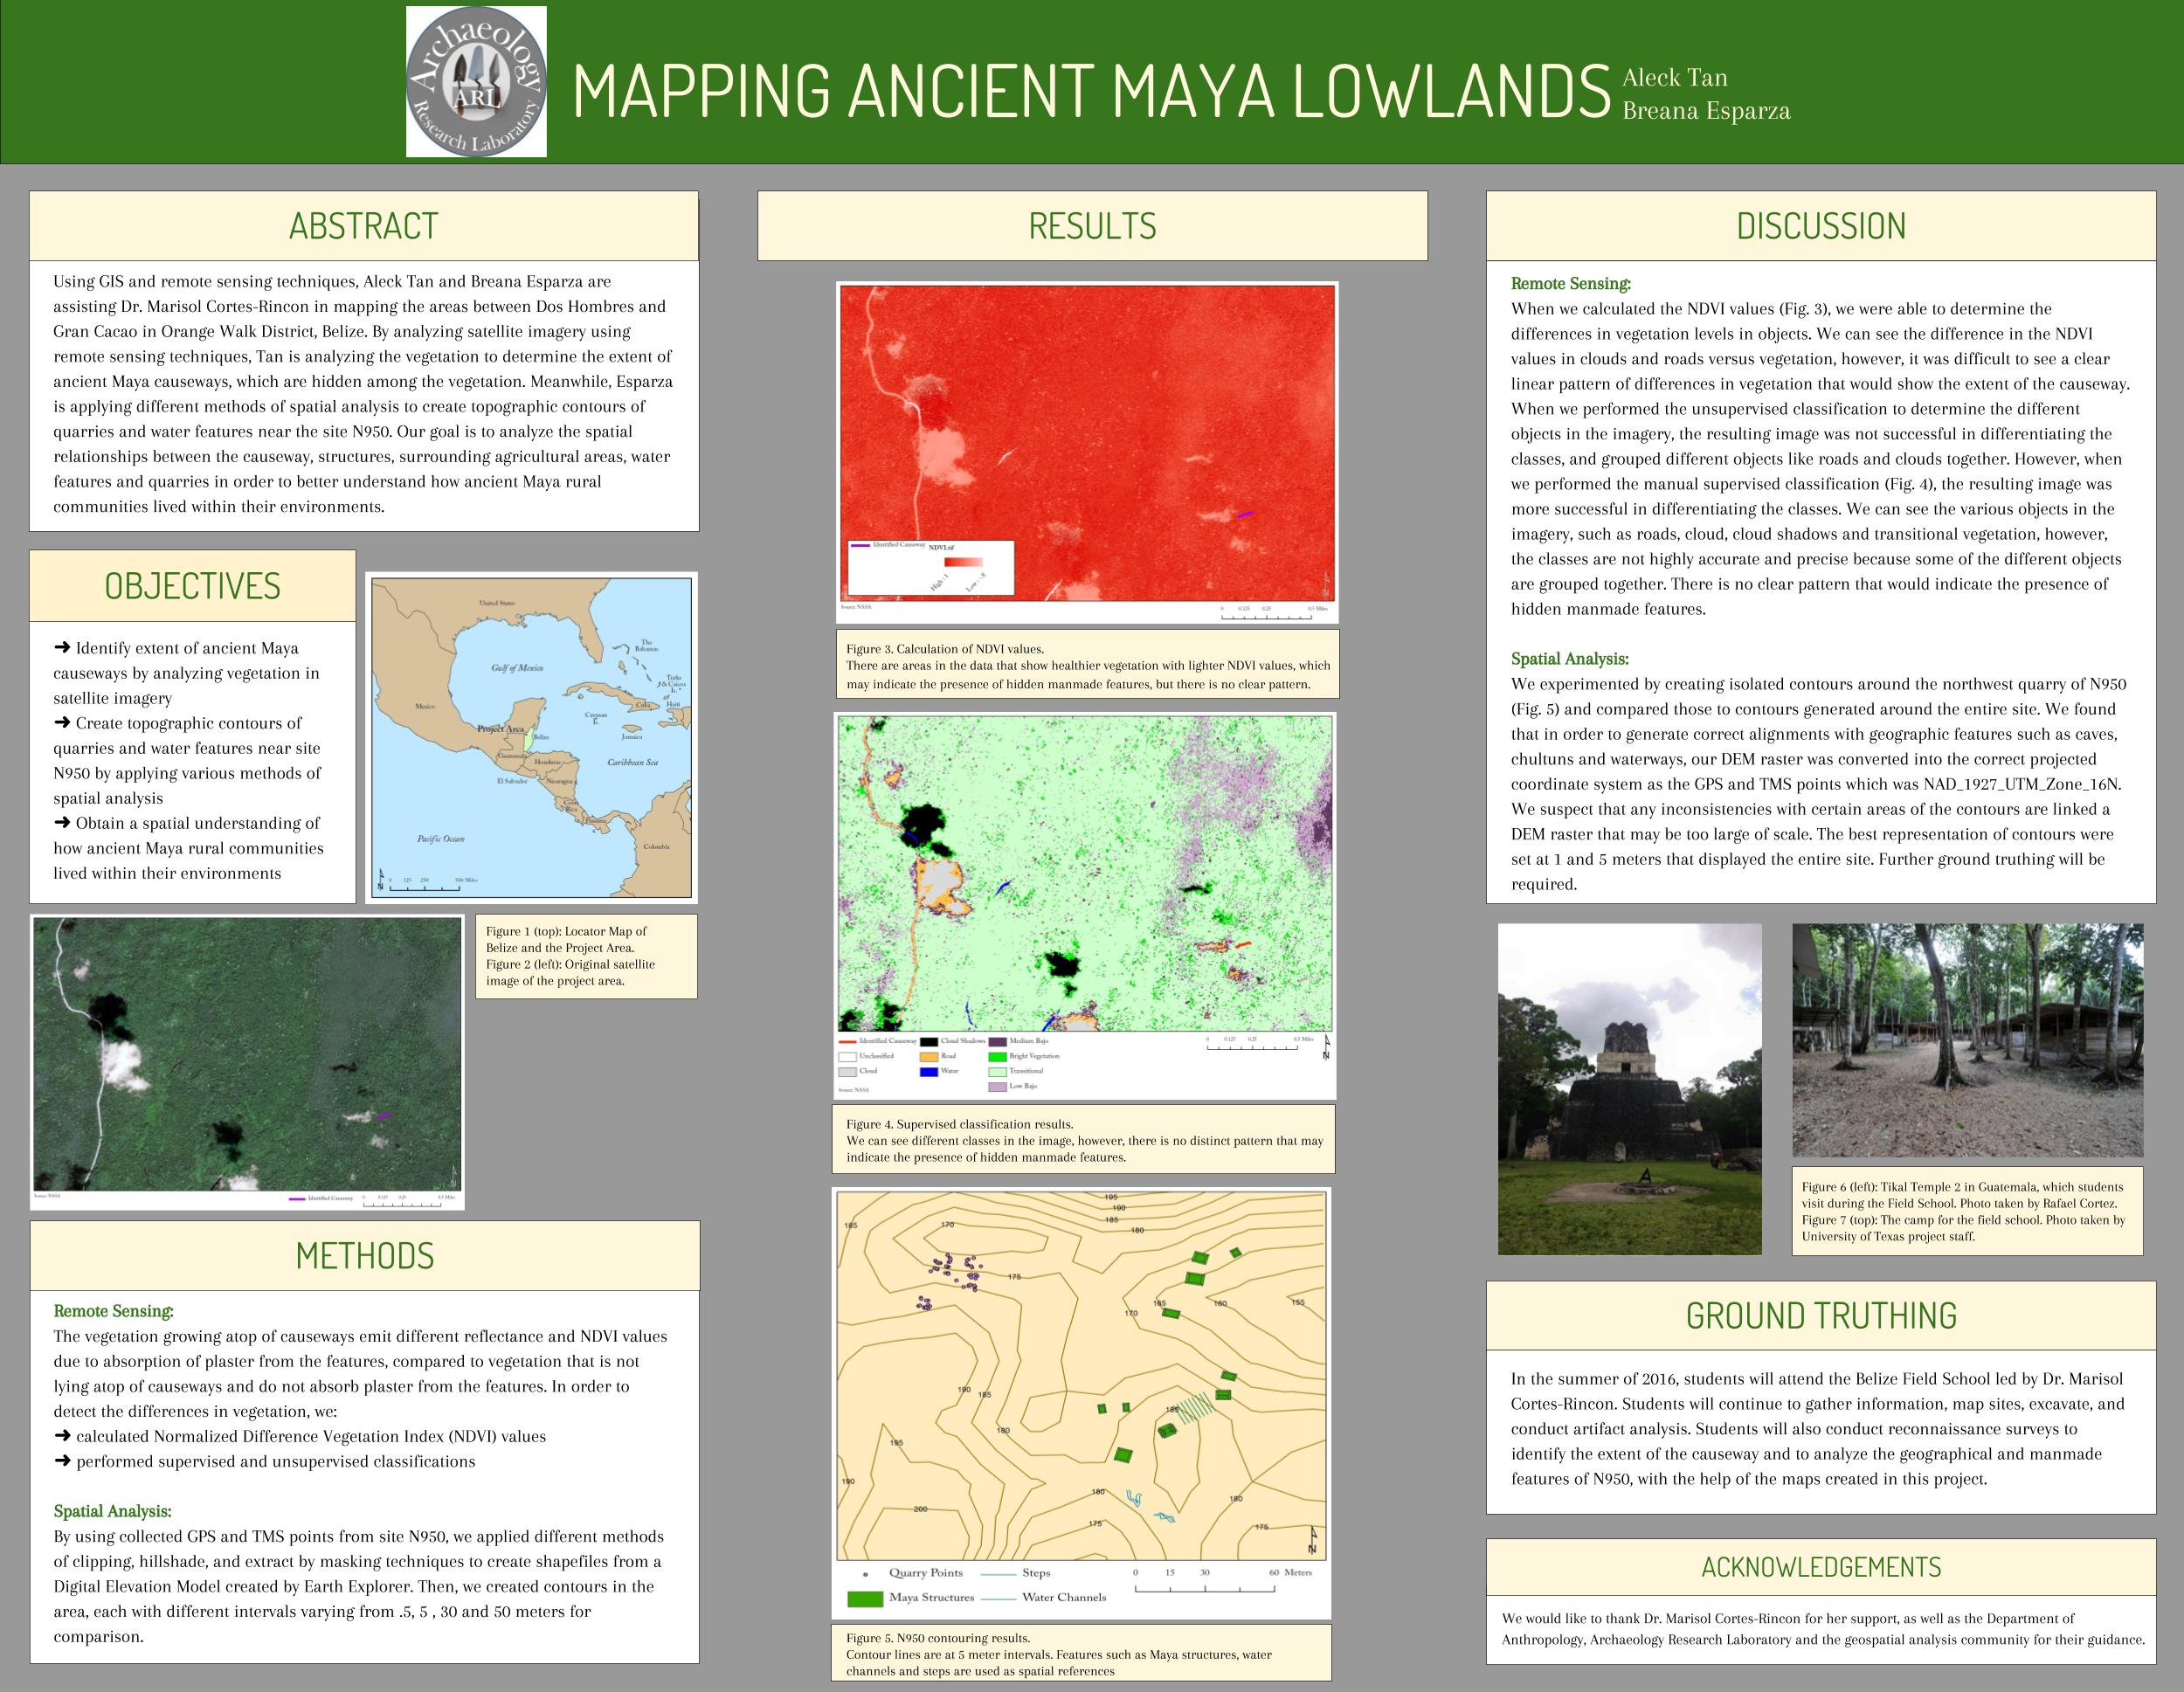
Since 1992, one large-scale archaeology project called the Programme of Belize Archaeology Project (PfBAP) has been focusing on the Rio Bravo Conservation and Management Area (RBCMA) in the Three Rivers Region located in northwestern Belize. The RBCMA covers approximately 260,000 acres, and is home to over sixty ancient Maya settlements (The University of Texas at Austin, Center for Archaeological & Tropical Studies 2016). Numerous Maya archaeologists work under the PfBAP permit umbrella in the RBCMA to conduct research on these settlements. One of these archaeologists includes Dr. Marisol Cortes-Rincon from Humboldt State University in Arcata, California. In her own project called the Dos Hombres to Gran Cacao Archaeology Project (DH2GC), Dr. Marisol Cortes-Rincon conducts research in the survey area between the Dos Hombres, Gran Cacao and the Great Savannah sites using a multidisciplinary approach of archaeology, geoarchaeology and ecology to determine the ancient Maya land uses and resource management (Figure 1). The study area is comprised of small household groups, reflecting commoner communities. The DH2GC project seeks to give a better understanding of ancient and past land use and structures in the area (Boudreaux et al.
2013).
Figure 1. A map of the northeastern section of the RBCMA area and the satellite imagery I am analyzing.
In previous field seasons, Dr. Cortes-Rincon and her team were able to identify linear causeways, or roadways, that connected sites. Mapping the causeway is an important research goal because causeways show the trade networks and the spatial relationships between communities (Boudreaux et al. 2013). We can possibly explore how communities interacted with one another. Due to the thick vegetation in the Belizean jungle, Dr. Cortes-Rincon and her team were not able to follow and map the extent of the causeways on the ground (Boudreaux et al. 2013).
PROPOSAL
For my research project, my goal is to determine the extent of the causeways identified in previous field seasons using remote sensing methods, and determine if remote sensing is a viable method to identify potential sites. My specific area of interest is approximately twelve kilometers of the survey transects between Dos Hombres, Gran Cacao and Great Savannah. Through remote sensing, we will use satellite imagery to identify the extent by examining the vegetation. My research is based on the idea that objects emit a unique spectral signature and have unique surface reflectance values based on their content (Hanna 2015a). The idea is similar to how individuals have unique fingerprints or signatures that are assigned only to them. Therefore, I believe that vegetation that is growing on top of features and absorbing the plaster from the features will emit a different signature than vegetation that is not growing on top of the features and not absorbing the plaster. Remote sensing techniques, such as creating a false color composite by calculating the Normalized Difference Vegetation Index (NDVI), and creating supervised classifications, may help to reveal differences in the vegetation that may indicate Maya sites (Hanna 2016b). After running these methods, I will look for strong correlations between the site size or site location and the distribution of vegetation types in order to see if a certain signature can display potential sites.
THEORIES
In conducting my research, I will apply two theories of archaeology: landscape archaeology and ecological archaeology. Studying the landscape of a culture is a crucial aspect of archaeology, as people have always operated and managed themselves spatially in an environment. However, it was only in the late 1900s that the field of landscape archaeology started to become more defined. Gordon Willey helped paved the way for landscape archaeology when he pioneered settlement pattern studies in Peru and Belize. With the using geospatial sciences (Anschuetz et al 169-170). Analyzing the landscape spatially will allow archaeologists to see site distribution and site patterns that otherwise cannot be seen on the ground.
Through landscape archaeology, we can analyze how the Maya people settled in various environmental zones (Fleming 2006). For the Maya, social organization was important, as rank and status of communities can be determined by location and size (Robichaux 1995). We can explore the social relationships of the Maya by looking at how they spaced themselves in the environment. For example, there are different types of sites that can be found across the landscape. There are temporary settlements, extended family groups, minor centers, capitals and territories. The Maya constructed these sites, including urban city-centers and small commoner communities, such as the ones in the study area (Robichaux 1995). The different levels of sites depict a social hierarchy, in that the higher-ranking people like elites live in large urban city centers, and the lower-ranking people live in the outskirts of cities or in rural areas landscape (Robichaux 1995). By studying and mapping the landscape and sites, we gain a better understanding how Maya settlements of various ranking communities interacted with one another.
Not only can we look at how communities interacted with each other, but we can also look how communities interacted with the environment through the theory of ecological archaeology. In the beginning of the field, archaeologists simply classified and described aspects of a culture through processual archaeology (Renfrew and Bahn 2012). Then, with the help of Gordon Childe, archaeologists started to place more emphasis on the individuals of the culture. Later on, Julian Steward developed the ecological theory to examine how cultures worked and interacted with the environment. Steward also places more focus on the study of how people adapted to their environments in order to survive (Renfrew and Bahn 2012). By interacting with the environment, people leave behind traces of their past human occupation.
For my project, understanding the vegetation and environment will be important in determining possible human uses of certain areas in the Maya Lowlands. During their occupation in Belize, the Maya made an impact on the landscape through intensive agriculture of dry lands and wetland and development of communities with various sites and structures across different environmental zones (Brokaw and Mallory 1993). The Maya also cultivated certain tree species that have descendants that are common today (Brokaw and Mallory 1993). By analyzing the vegetation on satellite imagery, we may be able to locate evidence of past human uses such as agriculture and development by unique surface reflectance values influenced by their content. With the ecological approach, we may be able to determine if the vegetation reflects past human use and occupation by vegetation (Brokaw and Mallory 1993).
According to previous research done in the site called Ma’ax Na in Belize by archaeologist Minda Hernke, there is a correlation between the level of Maya settlement and vegetation. Hernke argues that there is more evidence of settlement in upland zones with mild to moderate relief near bajos, or swampland (Hernke 1999). By using satellite imagery and vegetation, we can possibly locate sites like terraces and bajos by the vegetation. The interdisciplinary approach of landscape archaeology and ecological archaeology will help to build a more complete picture of the Maya landscape.
In order to efficiently analyze the landscape in the thick vegetation and low visibility, archaeologists use geospatial sciences to map, survey and examine an area, such as GIS and remote sensing (Morales-Aguilar et al 2015). GIS lets researchers allows collect, store and analyze spatial data and their attributes (Cunha 2015). On the other hand, remote sensing is the collection of environmental information indirectly (Hanna 2015). In other words, remote sensing allows researchers to collect tough-to-gather data by employing the use of remote equipment. In Maya archaeology, GIS and remote sensing can help reveal the traces of cultural remains that the Maya left behind (Morales-Aguilar et al 2015). Archaeologists like Dr. Cortes-Rincon are taking advantage geospatial sciences such as GIS and remote sensing to conduct surveys more efficiently.
GEOSPATIAL ANALYSIS
In order to efficiently analyze the landscape in the thick vegetation and low visibility, archaeologists use various tools to map, survey and examine an area, such as GIS and remote sensing (Morales-Aguilar et al 2015). GIS allows the collection, storage and analysis of spatial data (Cunha 2015). On the other hand, remote sensing is the collection of environmental information indirectly (Hanna 2015). In other words, remote sensing allows researchers to collect tough-to-gather data by employing the use of remote equipment. In Maya archaeology, GIS and remote sensing can help reveal the traces of cultural remains that the Maya left behind (Morales-Aguilar et al 2015). Archaeologists like Dr. Cortes-Rincon are taking advantage of these methods in order to conduct surveys for their projects more efficiently.
MODEL
An example of a successful archaeology project that used GIS and remote sensing is the San Bartolo-Xultun intersite survey project that was conducted in northeast Peten in Guatemala (Garrison 2007). For the intersite survey, William Saturno used satellite imagery from the National Aeronautics and Space Administration (NASA) to identify the different types of vegetation and sites in the study area. Saturno used high-resolution, multispectral images from Landsat, IKONOS and QuickBird satellites and manipulated their multispectral bands to create false color composites. A false color composite can depict a band that our eyes can’t normally see, which in this case, the near infrared band that shows vegetation. The false color composites reveal different density, health and types of vegetation in the near infrared by depicting them in color that our eyes can see (Hanna 2015b). Saturno found that areas depicting yellow and light blue pixels with a textured appearance were areas with large Maya structures and settlements. As a result, Saturno and his team were able to locate these areas on a map and navigate to them with more direction and ease (Garrison 2007).
By using San Bartolo-Xultun intersite survey as a large-scale model, we may attempt to apply similar remote sensing techniques in the smaller-scale DH2GC project in order to identify potential sites and analyze the vegetation in the research area.
DATA
In the previous field seasons, extensive survey and geospatial data collection was conducted for the DH2GC under the PfBAP’s permit umbrella, in order to better understand the landscape. Geospatial data consists of Global Positioning System (GPS) points and Total Mapping Station (TMS) points of various cultural features such as causeways, terraces, quarries and structures. The GPS and TMS points allow us to see where the structures are located in maps and satellite imagery (Boudreaux et al. 2013). Additionally, we obtained satellite imagery from the GeoEye satellite, as provided by a National Science Foundation grant. The satellite imagery has a 2m x 2m pixel resolution, as well as the four spectral bands necessary to analyze vegetation: red, blue, green, and near infrared. The image approximately covers 35,000 acres of the RBCMA area.
METHODS
Under Humboldt State University’s Archaeology Research Laboratory, I processed the data and applied two different remote sensing techniques using the program ENVI to analyze the Maya landscape. For the first method, I calculated the Normalized Difference Vegetation Index (NDVI) in order to determine the different levels of vegetation in the area. The method reveals different surface reflectance values through shades of red based on the varying levels of health and type of vegetation (Hanna 2016b).
Figure 2. Assigned training areas in the supervised classification method.
For the second method, I created a supervised classification, where I assigned areas called training areas to certain classes (Figure 2, Hanna 2016b). The classes that I used were: clouds, cloud shadows, roads, water, medium bajo, low bajo, transitional forests, and sites. I used expert knowledge from Dr. Cortes-Rincon to classify areas to the appropriate land cover types. I also used geospatial data to determine where the sites are located, so I can better classify the training area of sites to appropriate locations of known sites. Afterwards, ENVI found the average of the surface reflectance values of each area. Then, the program classified the entire image based on the average surface reflectance values of each assigned land cover type.
By analyzing the NDVI values of the different vegetation and the classes, I may able to identify the vegetation that is growing on top of settlements, and in turn, find correlations between site location, site size and vegetation.
RESULTS
Figure 3. NDVI Results.When I ran the NDVI method, I was able to determine the different health levels of vegetation (Figure 3). On the image, the lighter the area is, or the closer to the -1.0 NDVI value, the less healthy the vegetation is. The darker the area is and the closer to a +1.0 NDVI value, the healthier and denser the vegetation is. For example, you can clearly see the areas such as the roads, clouds and cloud shadows are depicted as lighter pixels due to the fact that these objects are not vegetation. While it is easy to see the major differences in vegetation health, it is difficult to see a clear linear pattern of vegetation that would indicate the extent of the causeway. In other words, by using observation, there are no clear clusters of similarly grouped NDVI values that would indicate the causeways and an extension of the causeways.
Figure 4. Supervised classification results.
When I performed the supervised classification to determine the different classes in the imagery, the resulting image was not very successful at differentiating between the classes (Figure 4). The program was able to classify some of the major areas, such as clouds and cloud shadows. However, the results were inconsistent as there were many problems with the image.
| Class | Percent Cover |
| Cloud | 5.439693 |
| Cloud Shadows | 3.226214 |
| Road | 0.121912 |
| Water | 0.181327 |
| Medium Bajo | 9.087013 |
| Transitional | 38.179184 |
| Low Bajo | 17.509936 |
| Sites | 26.254721 |
Figure 5. Percent coverage of each class in the supervised classification results.
There were three problems that I noticed in the supervised classification method. The first problem is the inaccurate classification. In the image, there appears to be a road on top of a cloud. The image also depicts numerous sites, or Maya settlements, around cloud shadows. In both cases, the classifications may not be accurate and precise. Roads do not go on top of clouds. Sites may also have been incorrectly assigned an average surface reflectance value that was close to the average surface reflectance of cloud shadows, so they were grouped close to each other in the resulting image. The second problem is my limited knowledge of the area. I may be incorrectly classifying areas because I do not have full knowledge of the study area. For example, I may have assigned areas as sites when they weren’t actually sites. The third problem with the classification is the limited coverage that the image offers. According to the results of the supervised classification, the clouds and the cloud shadows make up approximately 8.6% of the 35,000 acres of the image, or approximately 3,010 acres (Figure 5). I am missing 3,010 acres worth of information because of the obstructions of the clouds and the cloud shadows. As a result of the supervised classification, we can see major differences in the land cover types, however, the method is laden with problems. In order for the supervised classification method to be successful, more knowledge, more coverage and more accuracy at classification are necessary.
For both NDVI results and supervised classification results, there is one important point to highlight. In the study area, we are focusing on commoner household groups, where the structures are small and may not be clearly noticeable in the false color composites. In comparison, for the San Bartolo-Xultun intersite survey project, Saturno looked at larger structures that were more noticeable in the false color composites. Because the whole satellite image covers a large portion of the RBCMA, it may be difficult to notice the small nuances in vegetation levels that would indicate potential sites.
CONCLUSION
In conclusion, the remote sensing methods of NDVI and supervised classification were not successful in determining the extent of the causeway. There were no clear linear patterns or clusters of surface reflectance values that indicated the presence of known archaeological sites. If we cannot determine a unique signature or appearance of known features such as the causeways by observation, then it will make it difficult to search for and predict ancient Maya sites on the satellite imagert. In order to move forward with the research, it is crucial to significantly improve the remote sensing methods to achieve the same results as Saturno did for the San Bartolo-Xultun intersite survey project.
FUTURE RESEARCH
There are several suggestions and improvements that can advance the research project. For a new prediction technique, I may attempt to isolate and find a numeric average of the unique surface reflectance values of vegetation that is hiding known sites underneath. Then, I may find a way for ENVI to search the entire satellite imagery for that average surface reflectance value that would show the vegetation that is growing on top of features. This method, in addition to using more expert knowledge, may address the problems of inaccurate classification that was observed in the supervised classification method.
Another way to address the inaccurate classification and the NDVI results is to limit the study area to a smaller size so that we are only focusing on a small section of the image. We may be able to notice the smaller nuances in vegetation levels to predict small sites. By using this method, we can make certain that the training areas only cover an exact land cover type. Therefore, when ENVI averages out the surface reflectance value unique to the class, the classifications would be more accurate. Focusing on a small area to classify may prove to be time-consuming, as researchers will have to systematically go through each group of pixels to assign them to their appropriate land cover type. However, the rewards will be worth it, as we identify a unique surface reflectance value that will accurately reflect evidence of ancient Maya sites.
In addition, the satellite imagery itself posed as an obstacle for getting the visibility necessary to study all of the area. It is necessary to obtain satellite imagery that will allow me to see what is lying underneath the clouds and the cloud shadows so that those areas are included in the research. To address this need, I have applied for a scholarship from the Digital Globe Foundation through the American Society of Photogrammetry and Remote Sensing to obtain high-resolution satellite imagery that would match the satellite imagery we are currently using. If obtained, the satellite imagery provided by the Digital Globe Foundation will cover approximately 119,000 acres out of the 260,000 acres of the RBCMA, which is much larger than the area we are focused on. However, the new satellite imagery may reveal what is hiding underneath the clouds and the shadows in our current satellite imagery.
Ultimately, the main goal for the research project is still to find an efficient way to conduct surveys. If we constantly improve the remote sensing methods that we use, we may eventually be able to identify and predict ancient Maya sites better on satellite imagery. As a result, Dr. Cortes-Rincon and her team will save valuable time, money, and energy in conducting surveys in the Rio Bravo Conservation and Management Area.
WORKS CITED
Boudreaux, Sarah, Marisol Cortes-Rincon and Michael L. Brennan
2013 Dos Hombres to Gran Cacao Archaeology Project (DH2GC) 2013 Interim Field Report Programme for Belize Archaeology Project, Belize.
Brokaw, Nicholas V. and Elizabeth P. Mallory
1993 Vegetation of The Rio Bravo Conservation and Management Area, Belize. Manomet Bird Observatory and Programme for Belize.
Cunha, Mary Beth.
2015 21lectureGISandPO_S2015. Electronic document, accessed Dec 2, 2016.
Fleming, Andrew
2006 Post-Processual Landscape Archaeology: a Critique. Cambridge Archaeological Journal Cam. Arch. Jnl 16(03): 267.
Garrison, Thomas Gardner.
2007 Ancient Maya Territories, Adaptive Regions and Alliances: Contextualizing the San Bartolo-Xultun Intersite Survey. Ph.D. dissertation, Department of Anthropology, Harvard University.
Hageman, Jon B.
2004 Late Classic Maya Social Organization: A Perspective From Northwestern Belize. Ph.D. dissertation. Department of Anthropology, Southern Illinois University Carbondale.
Hanna, Sara
2015a GSP216_5-Spectral Reflectance. Electronic document, accessed Dec 2, 2016.
2015b GSP216_7-Digital Images-Lectures. Electronic document, accessed Dec 2, 2016.
2016a Lab 11: Image Classification. Electronic Document, http://gsp.humboldt.edu/OLM_2016/Courses/GSP_216_Online/labs/lab11.html, accessed Dec 2, 2016.
2016b Lab 11: Lab 9: Image Enhancements: Indices. Electronic Document, http://gsp.humboldt.edu/OLM_2016/Courses/GSP_216_Online/labs/lab9.html, accessed Dec 2, 2016.
Hernke, Minda
2001 Settlement Patterns West of Ma’ax Na, Belize. University of Wisconsin-La Cross Journal of Undergraduate Research 3.
Hammond, Norman
1982 The Prehistory of Belize. Journal of Field Archaeology 9(3): 349-362.
Morales-Aguilar, Carlos, Richard D. Handsen, Douglas Mauricio and Marvin Prado
2015 El Mirador Mapping Program 2003-2015: Investigation of an ancient Maya city with Total Station, Remote Sensing and GIS. Paper presented at the Annual Meeting of the American Anthropological Association, San Francisco, California, April 19.
Renfrew, Colin, and Paul G. Bahn
2012 Archaeology: Theories, Methods, and Practice. 6th edition. Pp 71-120 and 169-260. New York: Thames and Hudson.
Robichaux, Hubert Ray
1995 Ancient Maya Community Patterns in Northwestern Belize: Peripheral Zone Survey at La Milpa and Dos Hombres. Ph.D. dissertation, Department of Anthropology, University of Texas at Austin.
Sever, Thomas L. and Daniel E. Irwin
2003 Landscape Archaeology: Remote sensing investigation of the ancient Maya in the Peten rainforest of northern Guatemala. Ancient Mesoamerica, 14 (01): 113-122.
The University of Texas at Austin, Center for Archaeological & Tropical Studies
2016 The Programme for Belize Archaeological Project. Electronic document, https://liberalarts.utexas.edu/cats/pfbap/overview.php, accessed Dec 2, 2016.
